

As an MSP, monitoring and alerting are central to the services you provide. Good monitoring practices enable you to proactively identify issues, resolve them faster, and be more effective. Better monitoring can also play a key role in generating additional revenue and keeping your clients more satisfied.
The challenge is knowing what to monitor for, what requires an alert, which issues can be automatically resolved, and which need a personal touch. That knowledge can take years to develop, and even then the best teams can still struggle with reducing alert fatigue and ticket noise across client devices.
To help those just getting started condense that ramp-up time and narrow their focus, we’ve put together this list of ideas for 25+ conditions to monitor. These recommendations are based on suggestions from our partners and from NinjaRMM’s experience helping MSPs build effective, actionable monitoring.
How to Use the Checklists Below
For each condition we describe what is being monitored, how to set up the monitor in NinjaRMM, and what actions should be taken if the condition is triggered. Some monitoring suggestions are concrete while others may require a small amount of customization to fit them to your use case.
Note: While we've written this checklist with NinjaRMM and our customers in mind, these monitoring ideas should be easily adaptable to any RMM.
This list is also obviously not exhaustive, and may not apply to every situation or circumstance.
Once you’ve gotten started building out your monitoring around these suggestions, you’ll need to develop a more customized and robust monitoring strategy specific to your clients and their needs. We'll close out this post with additional recommendations to help with that effort and make monitoring, alerting, and ticketing a competitive advantage for your MSP.
Device Health Monitoring Checklist
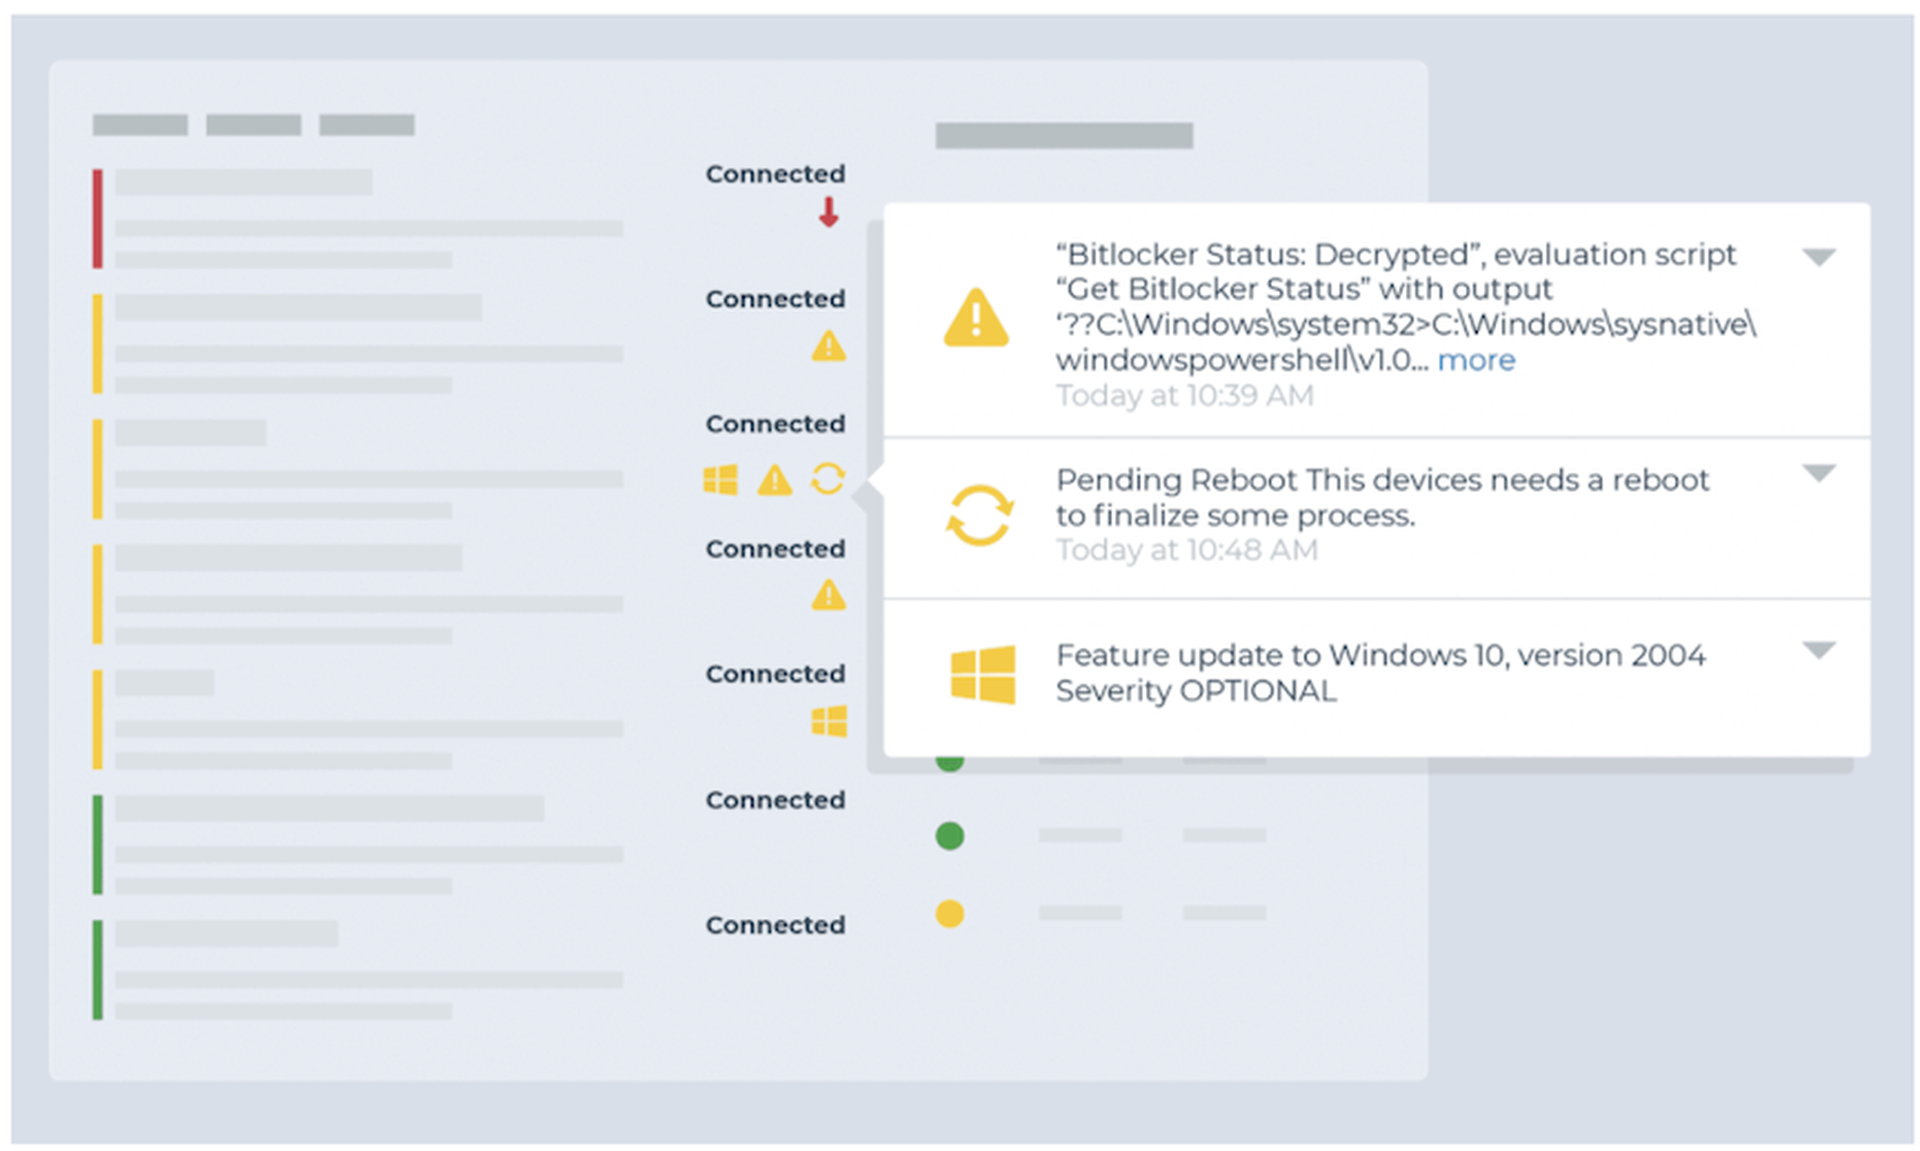
Monitor for continuous critical events
- Condition: Critical Events
- Threshold: 80 critical events over 5 minutes
- Action: Ticket and investigate
Identify when a device is unintentionally rebooted
- Condition: Windows Event
- Event Source: Microsoft-Windows-Kernel-Power
- Event ID: 41
- Note: This condition is better suited for servers as workstations and laptops can create this error from user intervention.
- Action: Ticket and investigate
Identify devices in need of a reboot
- Condition: System Uptime
- Threshold recommendation: 30 or 60 days
- Action: Restart the device during an appropriate window. Automated remediation may work for workstations.
Monitor for offline endpoints
- Condition: Device Down
- Threshold recommendation:
- 10 minutes or less (servers).
- 5 days or longer (workstations)
- Action:
- Ticket and investigate
- Wake-on-lan (servers only)
Monitor for hardware changes
- Activity: System
- Name: Adapter added / changed, CPU added / removed, Disk drive added / removed, Memory added / removed
- Action: Ticket and investigate
Drive Monitoring Checklist
Monitor for potential disk failure
- Condition: Windows SMART Status Degraded
and/or - Condition: Windows Event
- Event Source: Disk
- Event IDs: 7, 11, 29, 41, 51, 153
- Action: Ticket and investigate
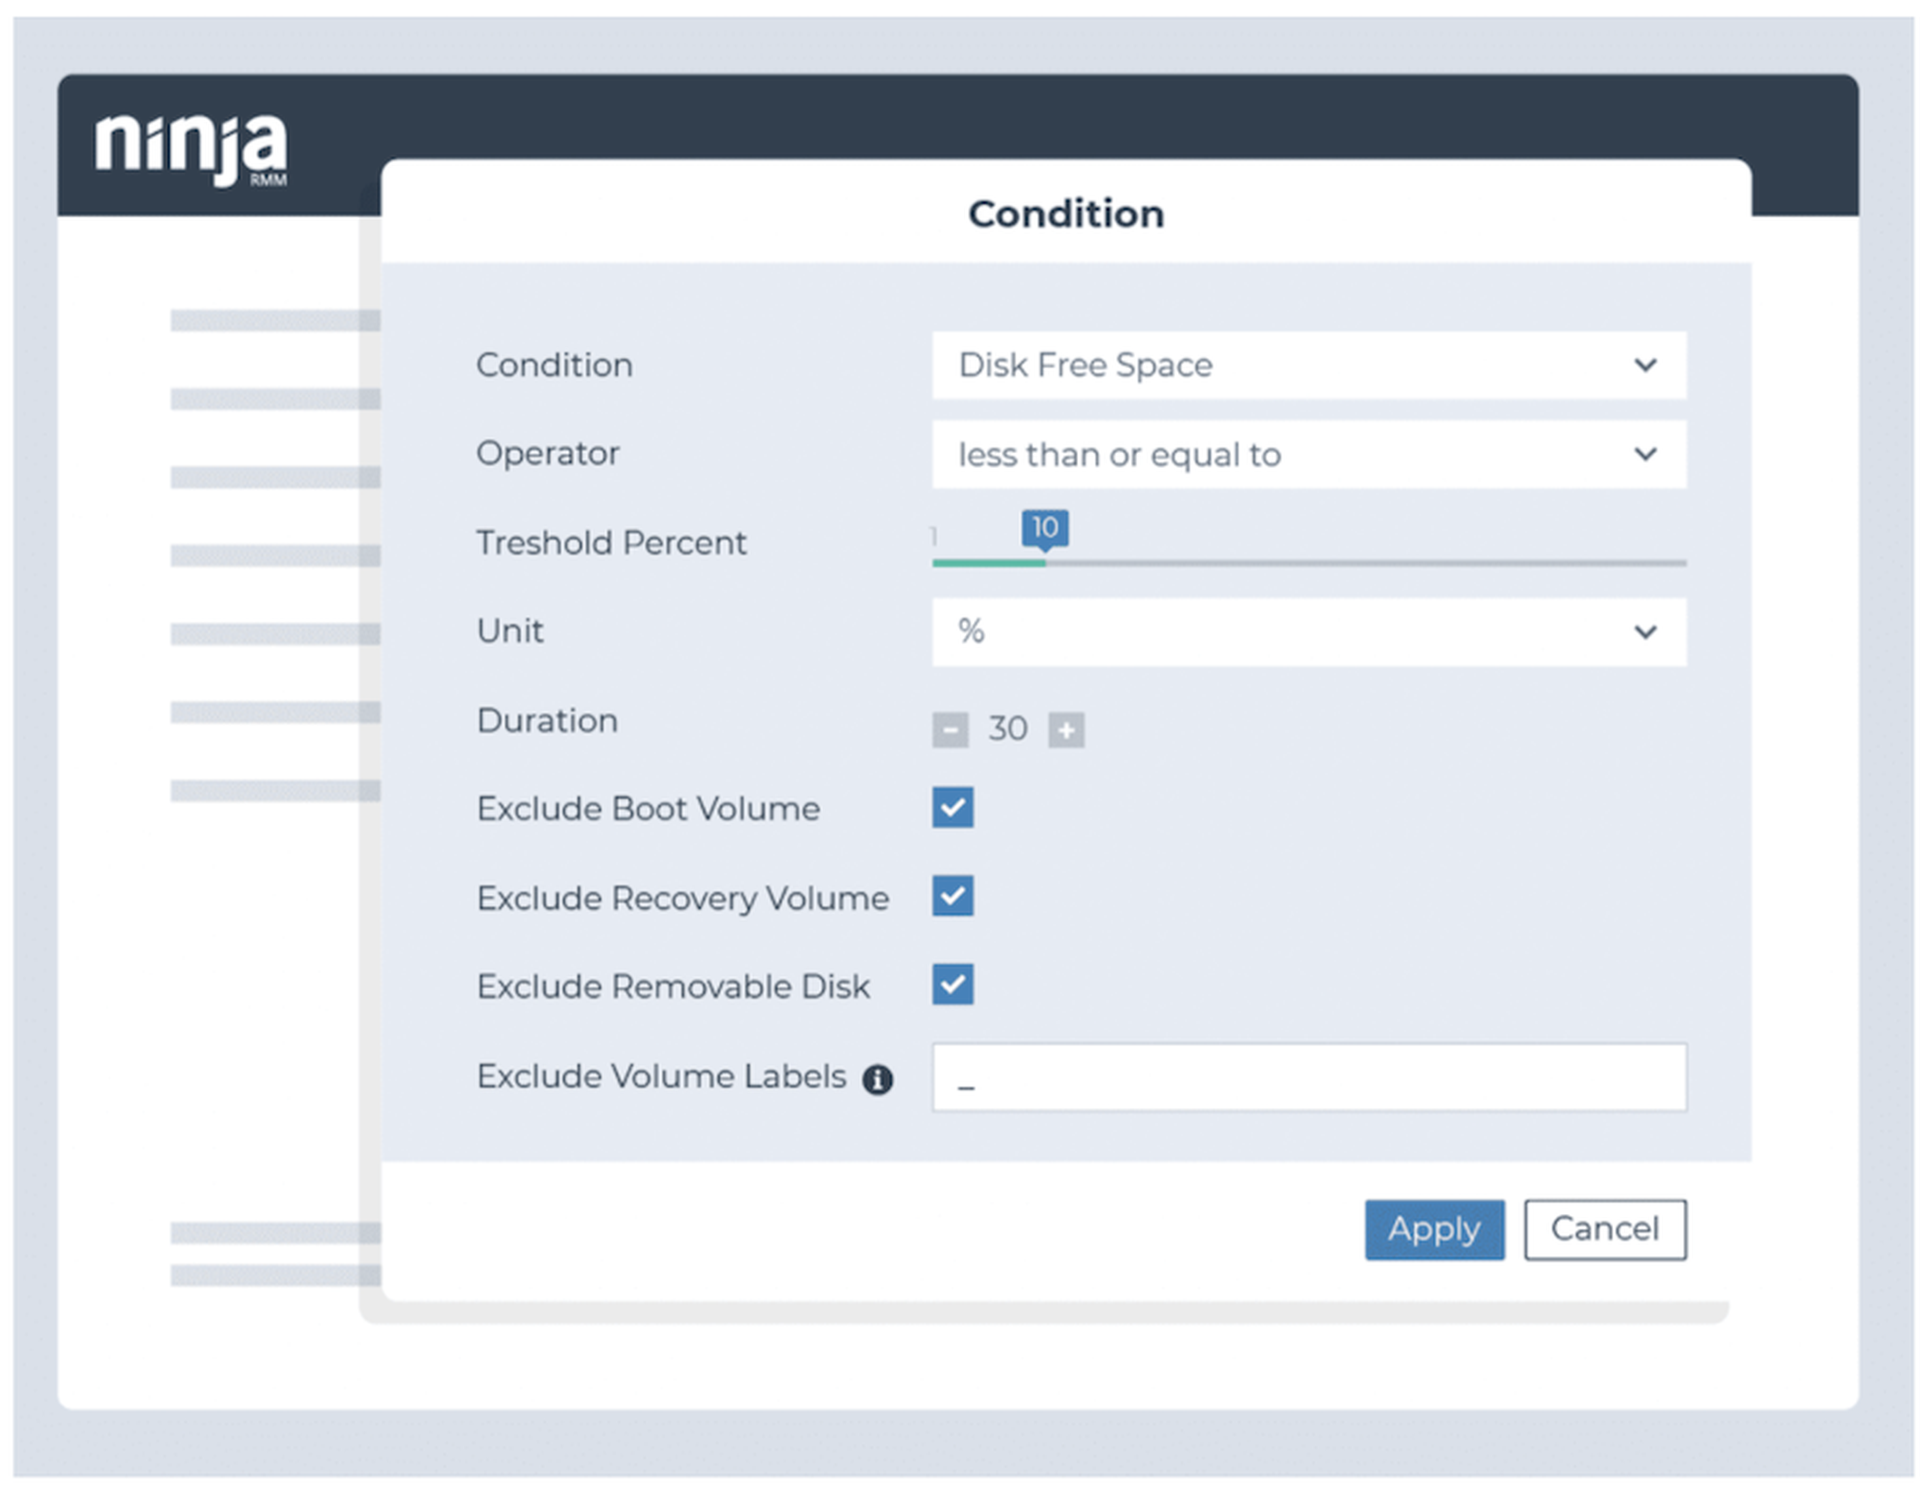
Identify when disk space is approaching capacity
- Condition: Disk Free Space
- Threshold: 20% and again at 10%
- Action: Perform disk cleanup and delete temporary files
Monitor for potential RAID failures
- Condition: RAID Health Status
- Thresholds: Critical and Non-Critical for all attributes
- Action: Ticket and investigate
Monitor for prolonged high disk usage
- Condition: Disk Usage
- Thresholds: 90% or greater to reduce noise, with 95%+ also being common over 30 or 60 minute periods
- Action: Ticket and investigate
Monitor for high disk activity rate
- Condition: Disk Active Time
- Thresholds: Greater than 90% for 15 minutes
- Action: Ticket and investigate
Monitor for high memory usage
- Condition: Disk Active Time
- Thresholds: Greater than 90% for 15 minutes
- Action: Ticket and investigate
Application Monitoring Checklist
Identify if required applications exist on an endpoint
- Condition: Software
- Usage:
- Client line-of-business applications (Examples: AutoCAD, SAP, Photoshop)
- Client productivity solutions (Examples: Zoom, Microsoft Teams, DropBox, Slack, Office, Acrobat)
- Client support tools (Examples: TeamViewer, CCleaner, AutoElevate, BleachBit)
- Action: Automatically install the application if it is missing and required
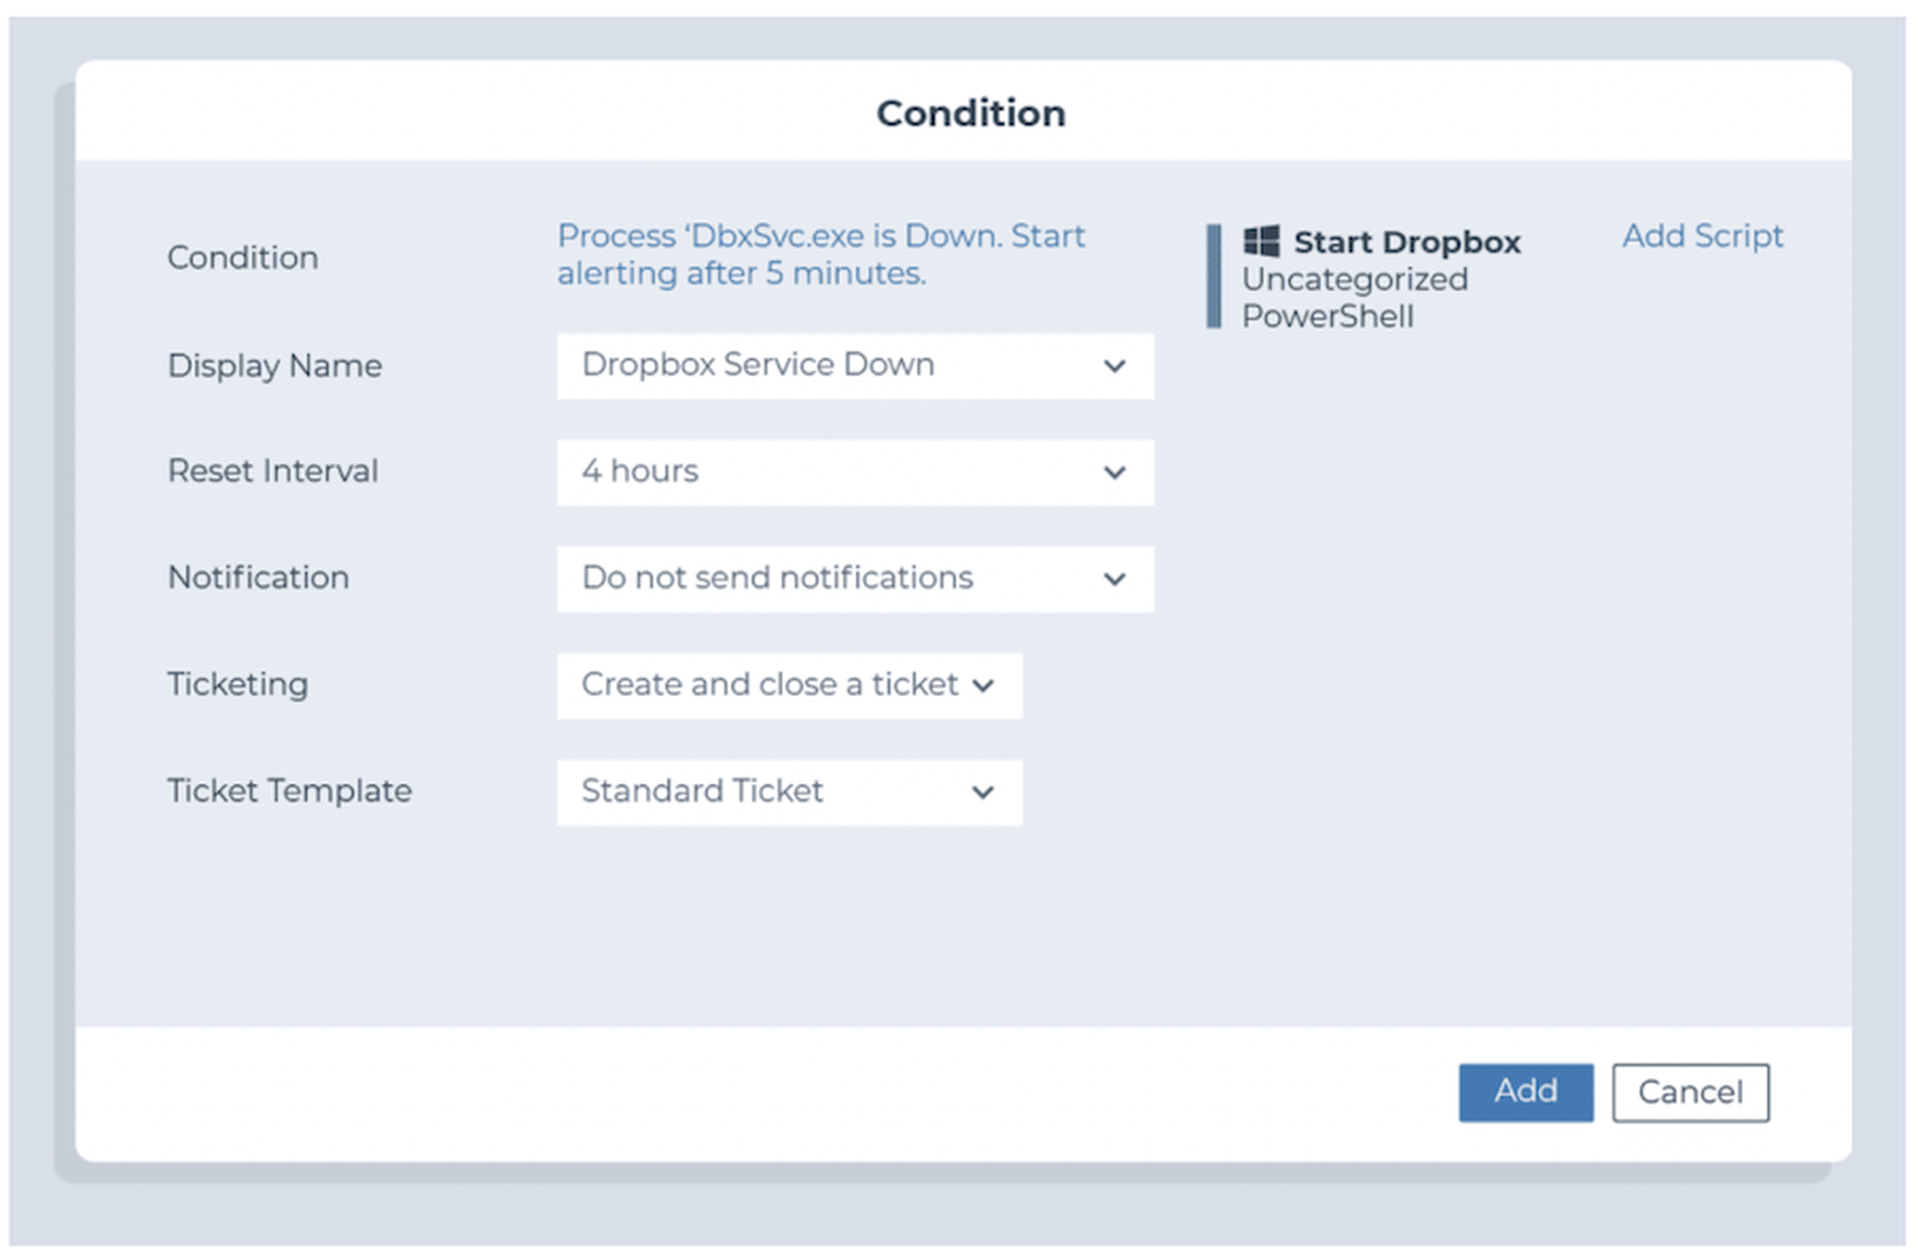
Monitor whether critical applications are running (particularly for servers)
- Condition: Process / Service
- Threshold: Down for at least 3 minutes
- Example Processes:
- For workstations: TeamViewer, RDP, DLP
- For an Exchange server: MSExchangeServiceHost, MSExchangeIMAP4, MSExchangePOP3, etc
- For an Active Directory server: Netlogon, dnscache, rpcss, etc
- For a SQL server: mssqlserver, sqlbrowser, sqlwriter, etc
- Action: Restart the service or process
Monitor resource usage for applications known to cause performance issues
- Condition: Process Resource
- Threshold: 90%+ for at least 5 minutes
- Example Processes: Outlook, Chrome, and TeamViewer
- Action:
- Ticket and investigate
- Disable at startup
Monitor for application crashes
- Condition: Windows Event
- Source: Application Hang
- Event ID: 1002
- Action: Ticket and investigate
Network Monitoring Checklist
Monitor for unexpected bandwidth usage
- Condition: Network Utilization
- Direction: Out
- Threshold: thresholds will be determined by the type of endpoint and network capacity
- Each server should have its own threshold based on its use case
- Workstation network monitor thresholds should be high enough to trigger only when a clients’ network is at risk
- Action: Ticket and investigate
Ensure network devices are up
- Condition: Device Down
- Duration: 3 Minutes
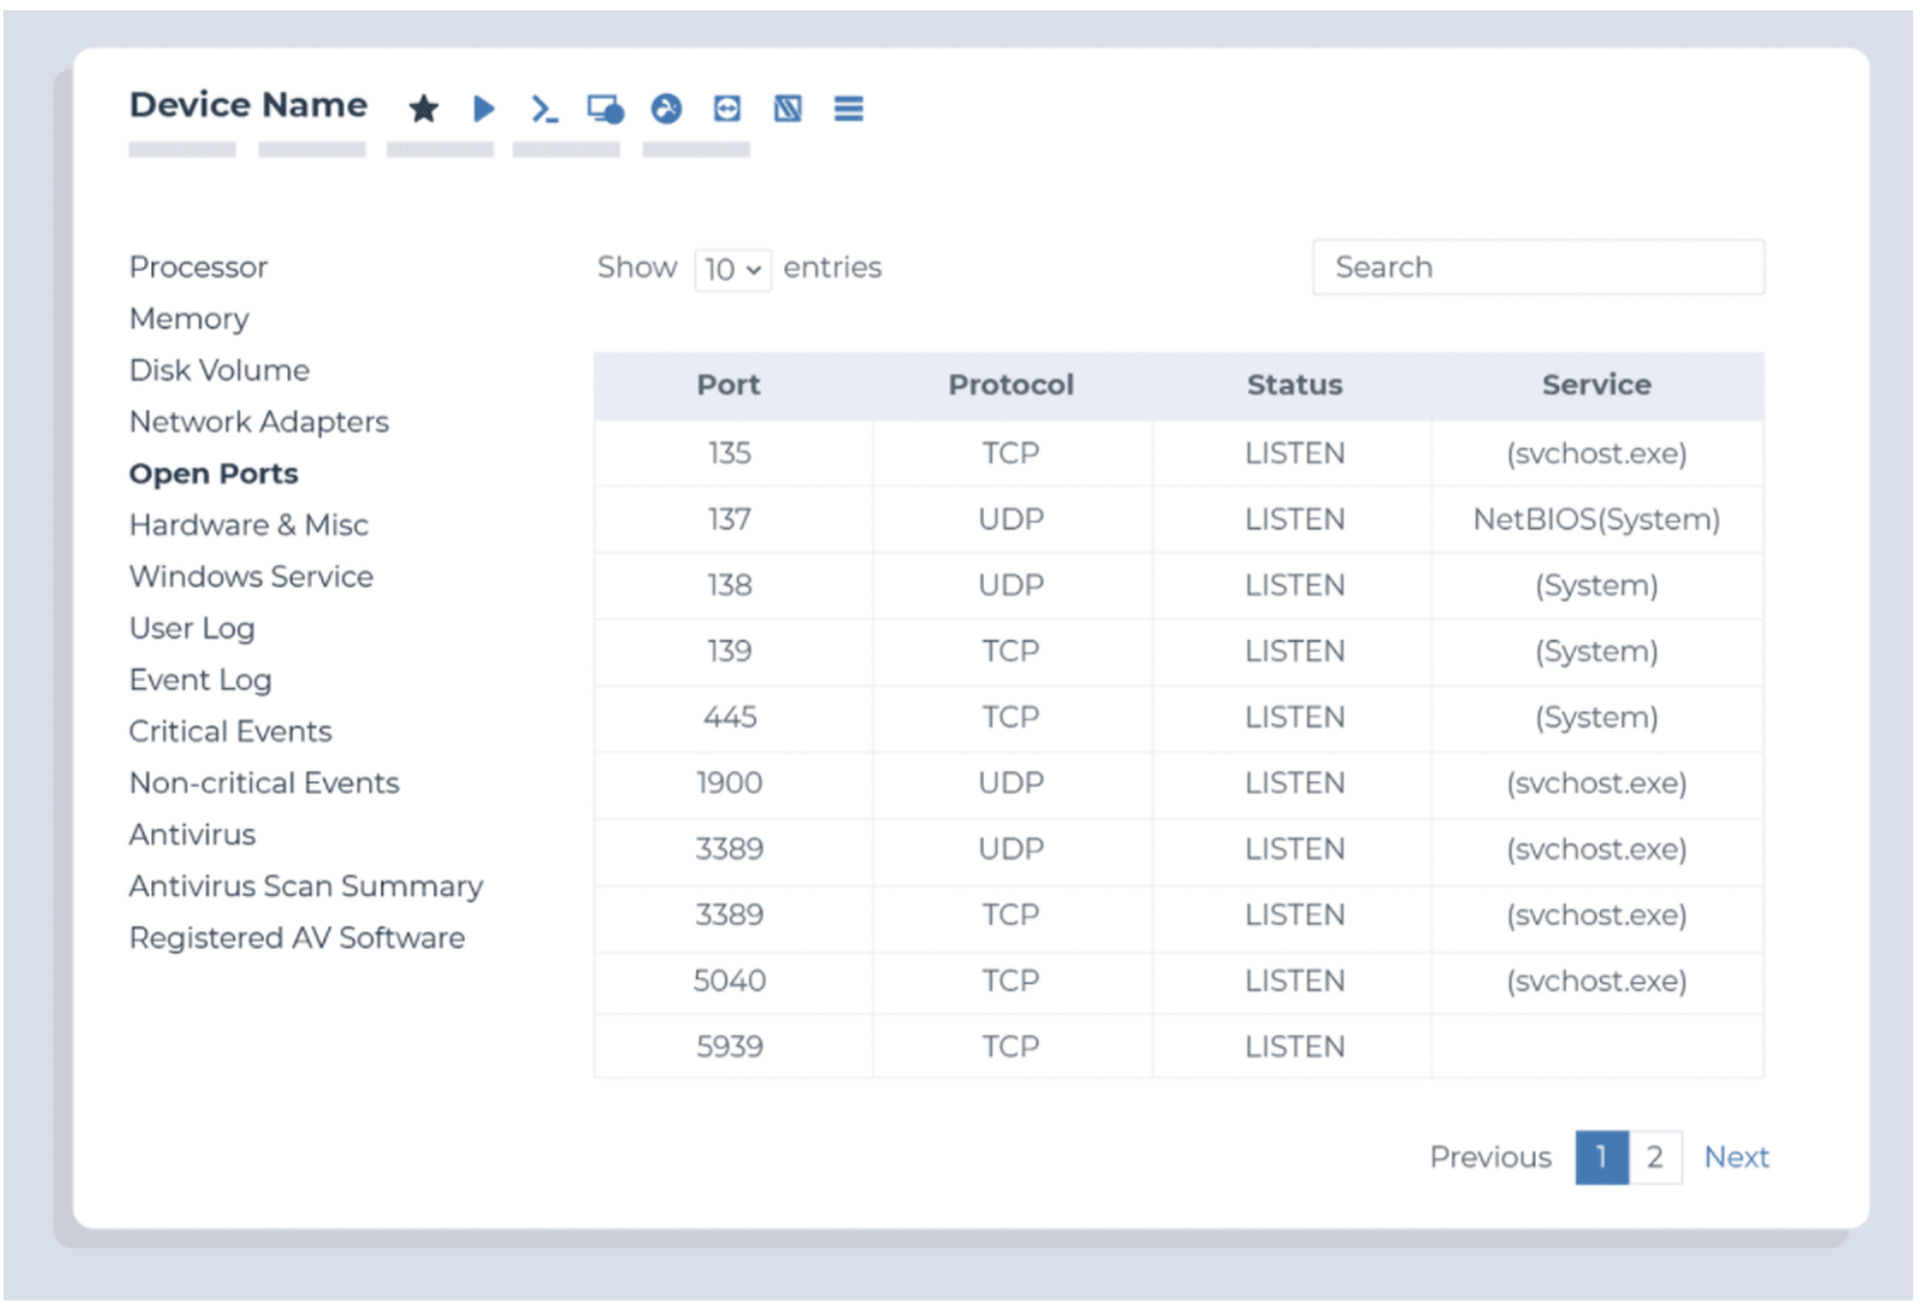
Monitor which ports are open
- Condition: Cloud monitor
- Ports: 80 (HTTP), 443 (HTTPS), 25 (SMTP), 21 (FTP)
Monitor client website availability
- Monitor: Ping
- Target: Client Website
- Condition: Failure (5 times)
- Action: Ticket and investigate
Basic Security Monitoring Checklist
Identify if Windows Firewall has been turned off
- Condition: Windows Event
- Event Source: System
- Event ID: 5025
- Action: Turn on Windows Firewall
Identify if antivirus and security tools are installed and/or running on an endpoint
- Condition: Software
- Presence: Doesn’t Exist
- Software (examples): Huntress, Cylance, Threatlocker, Sophos
- Action: Automate the installation of the missing security software
and - Condition: Process / Service
- State: Down
- Process (examples): threatlockerservice.exe, EPUpdateService.exe
- Action: Restart the process
Monitor for unintegrated AV / EDR threats detected
- Condition: Windows Event
- Example: (Sophos)
- Event Source: Sophos Anti-Virus
- Event IDs: 6, 16, 32, 42
Monitor for failed user logon attempts
- Condition: Windows Error
- Event Source: Microsoft-Windows-Security-Auditing
- Event IDs: 4625, 4740, 644 (local accounts); 4777 (domain login)
- Action: Ticket and Investigate
Monitor for the creation, elevation, or removal of users on an endpoint
- Condition: Windows Error
- Event Source: Microsoft-Windows-Security-Auditing
- Event ID: 4720, 4732, 4729
- Action: Ticket and Investigate
Identify if the drives on an endpoint are encrypted/unencrypted
- Condition: Script Result
- Script (Custom): Check Encryption Status
- Action: Ticket and Investigate
Monitor backup failures (Ninja Data Protection)
- Activity: Ninja Data Protection
- Name: Backup job failed
Monitor backup failures (other backup vendors)
- Condition: Windows Event
- Example Source / IDs (Veeam):
- Event Source: Veeam Agent
- Event IDs: 190
- Text Contains: Failed
- Example Source / IDs (Acronis):
- Event Source: Online Backup System
- Event ID: 1
- Text Contains: Failed
4 Keys to Leveling-up Your Monitoring
- Create a baseline device health monitoring template.
- Talk to customers about their priorities.
- Which servers and workstations are important?
- What are their critical line of business or productivity applications?
- Where are their IT pain points?
- Monitor your PSA / ticketing system for recurring issues.
- Adjust alerting to avoid ticket noise.
- Monitor clients’ event logs for recurring issues.
Ticketing & Alerting Best Practices
- Only alert on actionable information. If you don't have a specific response associated with a monitor, don't monitor it.
- Categorize your alerts to go to different service boards in your PSA based on the type or priority.
- Host regular alert housekeeping meetings to discuss:
- Which alerts are causing the most noise? Can they be removed or narrowed in scope?
- What is not being monitored or creating notifications that should be?
- Which common alerts can be automatically remediated?
- Are there any upcoming project that may generate alerts?
- Clean up your tickets and alerts when they are resolved.
- In NinjaRMM, many conditions have a ‘Reset when no longer true’, or ‘Reset when not true for x period’ to help you resolve and clean up notifications that may resolve themselves.
Looking for More Monitoring Ideas?
See Kelvin Tegelaar's excellent series on remote monitoring using PowerShell. He covers how to monitor everything from network traffic to Active Directory health to Office 365 failed logins, Shodan results, and more. Best of all, he shares PowerShell scripts that are designed to be RMM agnostic.
We regularly feature his blog posts along with plenty of additional tools and resources in our weekly MSP Bento newsletter. Subscribe now to get the latest edition along with a special list of the most popular tools and resources we've shared.
Author Peter Bretton is product marketing manager at NinjaRMM. Read more guest blogs from NinjaRMM here.