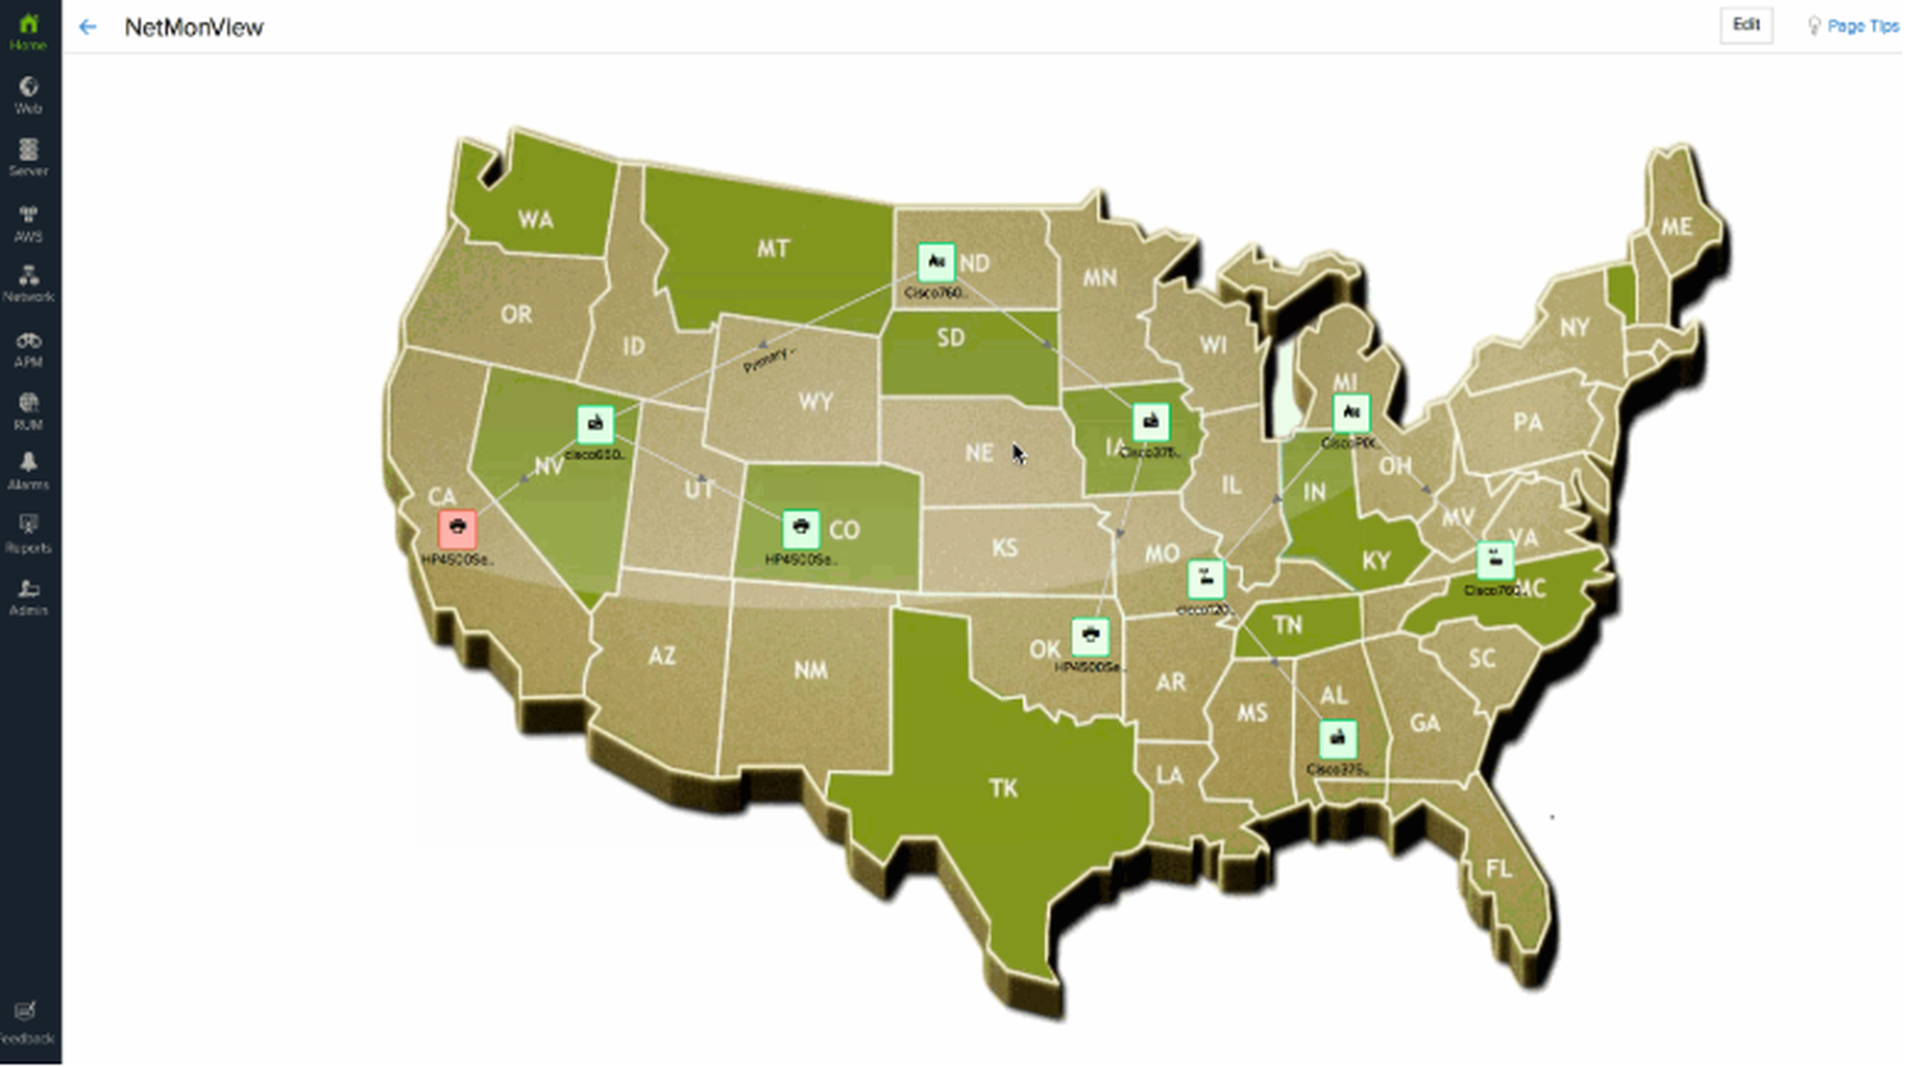
The ability to visualize your IT infrastructure from end to end is critical in fostering successful operations and delivery of service. Being a network admin, you need to keep a close eye on all your network devices, whether they're across the globe or inside your data centers. However, this is difficult to do without an actual location-based topology map of your network infrastructure. That's why we've built an infrastructure mapping tool from the ground up to help you customize and create network topology maps for your IT stack. Let's learn a bit more about infrastructure maps and some of the key capabilities you should leverage to complement your monitoring efforts.
Overview
With Site24x7's Business View, IT admins and network engineers can categorize monitors to facilitate better visualization of their IT infrastructure, identify dependent resources, and spot potential performance bottlenecks with ease.
Infrastructure maps offer an enhanced network mapping experience, allowing you to create a high-quality, service-aware view of your infrastructure, including details about how your devices are interconnected. You can manually create a schematic description of your network's topology by logically arranging your physical nodes, network devices, interfaces, and links over a predefined or custom background.
Your infrastructure map helps you:
- Understand the association between parent and child monitors.
- Spot network problems at a glimpse; simply hover over any monitor to see basic details such as device category, host name IP address, operational status, and much more. Click on any monitor icon to see performance data about that monitor. Hover over any linkages to see details about the connection and the interfaces on each end.
- Troubleshoot problematic monitors or links causing potential roadblocks.
- Prioritize network faults and start remediation actions.
Why do you need an infrastructure map?
As a network admin, having a comprehensive understanding of your network's topology is vital. Here are some things to consider when deciding whether or not infrastructure maps would be a useful addition to your arsenal:
- If you ever need to redesign your network setups, such as adding a new router or a new data link to your remote office, it's imperative to first understand how the network traffic would flow through this new route.
- While troubleshooting an issue, it's important to first verify whether or not there are firewalls in the way, or whether there are particular bottlenecks causing bandwidth congestion issues.
- Whenever a device has trouble transmitting a signal to another device, you need to have a context-aware map of your network to learn more about this weak signal.
- Network topology maps are a must-have for PCI audits. PCI auditors will need to know where your servers and firewalls are, as well as the various ways to access the network.
How do you use infrastructure maps?
Let's discuss some common mapping techniques and useful topologies that you'll run into.
Global, regional, and physical location-based maps
Being a network admin, you'll have to closely monitor and track your edge devices regardless of where they're located. With an infrastructure map, you can change your background image to reflect your geography, and then plot semantic connections between your infrastructure monitors. Once this is done, you'll be able to visualize how well the connections are operating between these locations.

By changing the background image to something like your data center layout or server rack image, you can place all your devices in their appropriate positions, map them, and start monitoring these resources.
Hierarchical maps
When you've got numerous grouped and interlinked network devices and IT resources, it's particularly hard to discern issues and identify traffic routes during a network audit. A hierarchical map of your network lets you plot the entire network layout on a single pane. Hierarchical maps help you break down your network with a top-down dependent network map, avoiding any cluttered maps.

Virtualized network
You can apply the hierarchical view to your virtual networks as well. Hyper-V and VMware vSphere environments can be easily plotted on a single map. You can quickly see the relationship between various devices like vCenter servers, ESX/ESXi servers, VMs, and datastores, as well as their interlinkages.

Try it now!
If you want to know how to draw your network topology map using our infrastructure map, refer to our user guide. If you'd like to see any further enhancements or additional features, feel free to post your ideas on our community wall. Meanwhile, if you have any questions, please contact us at [email protected]. We look forward to receiving your valuable feedback and suggestions.
Guest blog courtesy of Site24x7. Read more Site24x7 blogs here.


